- Home
- Blog
- YouTube Videos
- The Most Important YouTube Video Analytics Explained
The Most Important YouTube Video Analytics Explained
Updated on February 18, 2025

Whether you’re a marketer or just an entertainer and content creator, you probably know that the most difficult part of the job isn't creating the videos themselves.
Sure, editing YouTube videos isn't easy. It can require a lot of hard work and dedication, but with tools like Flixier that streamline the editing process and with today's abundance of online tutorials and resources, the editing stops being difficult pretty quickly. Most often, the part that stays difficult is the time you spend between uploading your last video and editing your newest one.
That's the time that you need to spend doing research, trying to come up with new ideas and, most importantly, analyzing your existing content to figure out what your audience likes and what it doesn't like. The landscape of online video content has changed a whole lot over the past few years and the sheer amount of content that people are getting bombarded with every day means that it takes a lot of planning and effort if you want your videos to reach people. It takes even more work if you want to make videos that people will actually click on and watch.
Luckily for you though, video analytics have also improved a lot in this time period in order to accommodate this increased need for planning and strategy. Gone are the days when the number of views was the only metric you could use to determine whether or not a video was successful.
Nowadays, all major video platforms, including YouTube, Vimeo and Flowplayer offer content creators access to stats such as Audience Retention, detailed demographics, top traffic sources and more.
This is all incredibly important information to keep in mind when developing your content strategy, but how are you supposed to use it if you don’t fully understand it? Well, don’t worry anymore. We’re here to help you out by breaking down the most important data and helping you understand what it means.
1. Audience Retention
One of the most important stats in this list, Audience Retention tells you how far people make it into your video before they stop watching.

Audience Retention is one of the more important stats that YouTube takes into account when deciding whether or not your video is good enough to recommend to other people, something that’s indicated by its prominence on the Video Analytics page.
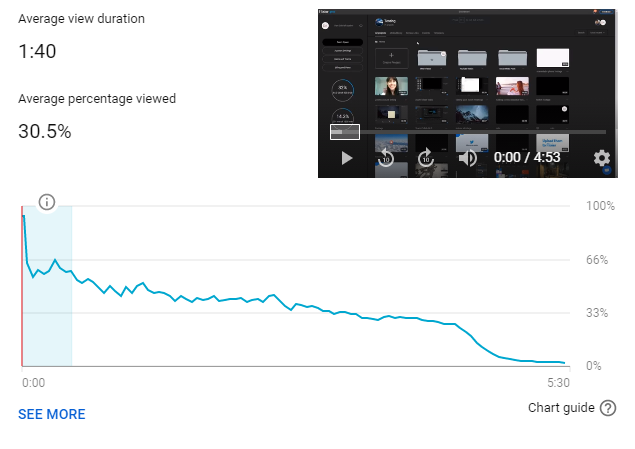
In the screenshot above, you can see that our clip has an Average View Duration of 1 minute and 40 seconds, which represents 30.6% of the video’s total length. A lot of people tend to skip around through videos, so that shouldn’t really be surprising.
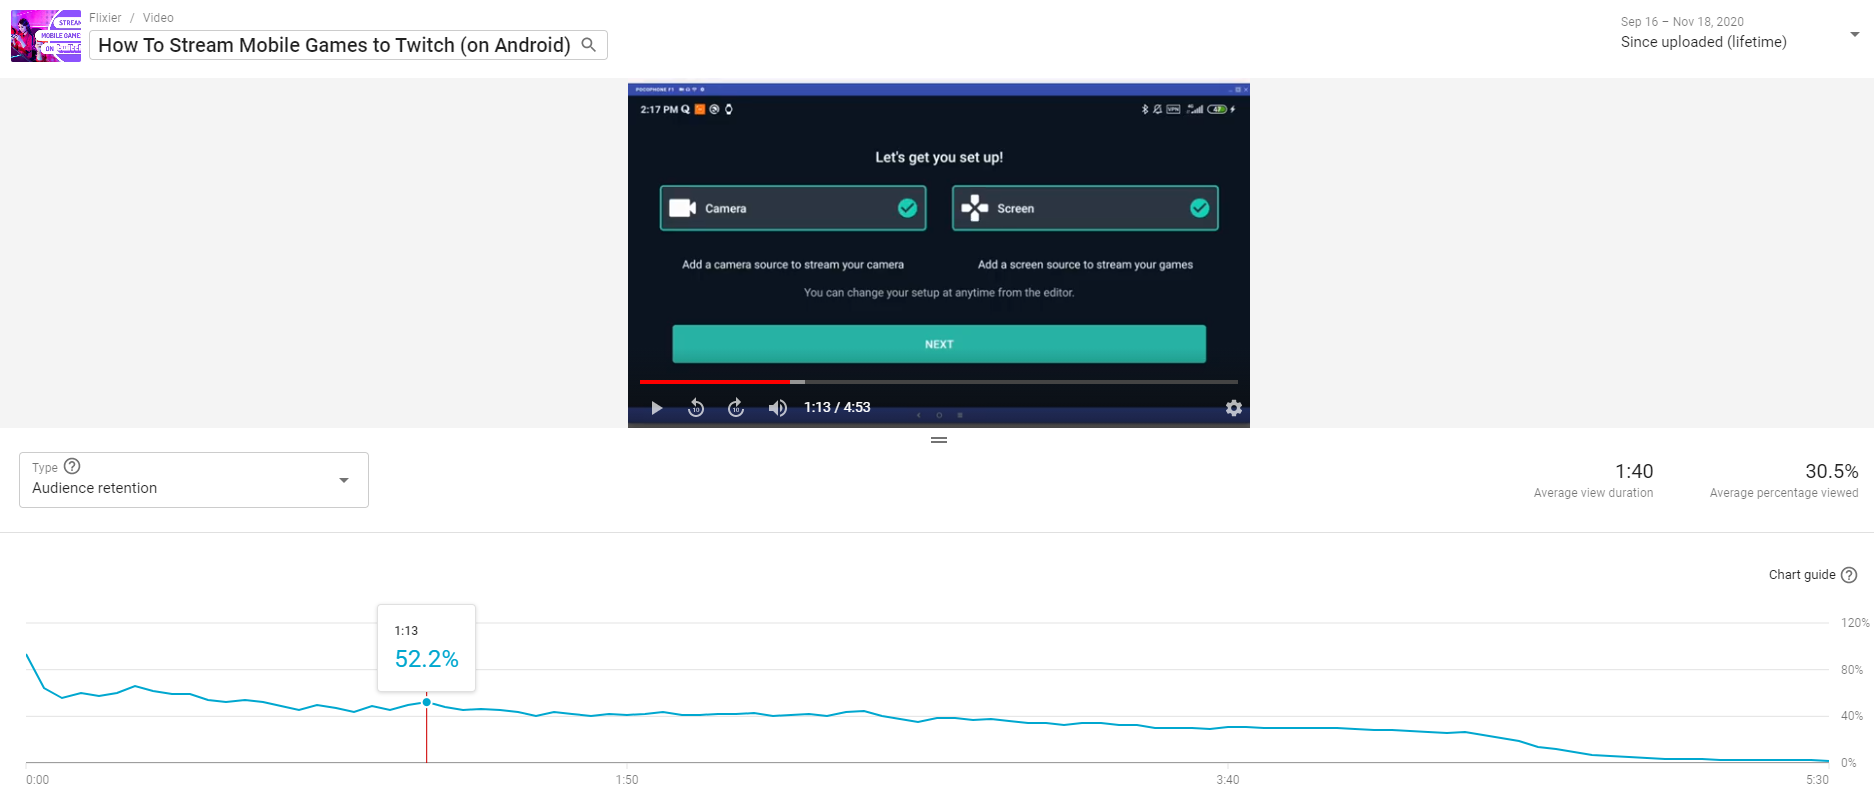
The real treasure trove of information lies in the graph under the video. Click on the See More button to see a full-screen version of it.

The horizontal axis represents the length of your video, while the blue line tells you how many people were watching at any given moment of it. You can even hover over the line to get a percentage value, or click on it to have the video preview above display the exact moment in the video.
What that means is:
- A dip in the graph represents a part of your video that people usually skip over
- Continuous lines are parts of the video that keep people constantly engaged.
- Spikes in the graph are moments that get shared or re-watched a lot.
In our example, a quick glance shows you a dip corresponding with the intro (since most people on YouTube are used to skipping over the first part of a video to get to the actual meat and bones of the content faster), a few spikes along the way and then a constant downward line towards the end, as people naturally turn the video off during the 20 seconds long end-screen.
This tells us that the intro wasn’t really all that effective, and we could do with it being a bit shorter.
Depending on the type of content you’re making and the target audience you’re trying to reach, your graphs might be wildly different from our example. Ideally, you’d want the Audience Retention graph to look flat, since that would mean your audience is constantly engaged throughout the clip.
But if your graph is rather spiky, there’s no need to worry! Use it to learn what people enjoyed and what they skipped over. Then, keep this information in mind when planning your future content and watch your audience retention improve!
BONUS TIP: If you want to grow your YouTube channel, don't dismiss short-form content or alternative video platforms! TikTok videos have more reach than YouTube videos, and right now YouTube is signal boosting Shorts, so this type of content can be a great way to reach more people than traditional videos. You can use the Audience Retention chart to figure out what the most exciting parts of your videos are, then use a YouTube video cutter like Flixier to turn those parts into vertical, short-form videos that can get more people's attention and get them to visit your channel for the full video clip.
2. Top Traffic Sources
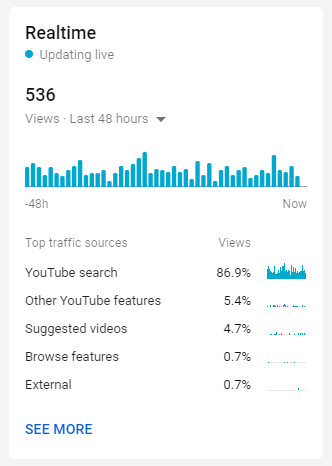
The Top traffic sources list tells you how people end up watching your video.

In our case, the biggest source of traffic is YouTube search. This means that most people find our video by searching for a similar topic. Your video showing up in the search results is very good, since it means that you did a good job with the Title and Description.
However, analyzing your SEO is not the only thing this statistic is good for. It also helps you get an idea of how often your videos show up on your subscribers’ home page, or often your videos are recommended to people after watching something else (the Suggested Videos section).
Most importantly, though, if you see External listed in your top traffic sources, it means that your video is being shared somewhere else on the internet.
You can get more granular, detailed information about external traffic sources by switching over to the Reach tab. Here, you’ll find a breakdown of all the websites that direct people to your video.

If you see significant sources of traffic here, make sure to look into them. If your video is being shared on a popular blog, for example, try getting in contact with the author and see if you can collaborate on a project.
If you notice a lot of traffic coming from a certain subreddit or other forum, check out the community to see if you could make more content that would be valuable to them. If you’re using YouTube to market a product or service, try to offer exclusive deals to members of these communities, since that’s more likely to make them feel appreciated and convert them into customers.
3. Click-Through Rate
Since we’re already looking at the Reach tab, it’s also important to mention the Click-Through Rate.
This percentage tells you how many of the people that were presented with your video (that had it show up in their Suggested Videos or on their YouTube homepage, for example) actually clicked on it.

The Click-Through rate is important because it lets you know how effective your titles and thumbnails are.
The thumbnail is the main thing that people take into account when deciding whether or not to click on your video. That’s why it’s important that you put effort into creating thumbnails that are colorful, representative of the video and on-brand.
After all, what’s the point of putting hours of effort into a video that no one will watch because you only spent 5 minutes on the thumbnail?
If you need some quick pointers to improve your thumbnail, you should know this:
Solid colors work really well! Red, green, yellow or blue are generally considered among the best colors to use as a background.
Faces are great for drawing people’s attention, especially if they show strong emotions like happiness, sadness or surprise.
Logos can work in your favor, if you manage to make them both recognizable and small enough that they don’t get in the way.
Thumbnails need to be representative of the video. If the thumbnail leads people to expect something from your video and your video doesn’t deliver, those people are going to leave early or even dislike the clip. Low audience retention and a high number of dislikes will hurt your channel a lot more than a low Click-Through rate, so make sure to keep your thumbnails honest and representative.
Your thumbnails should follow the same format. If possible, try to have some sort of unity to your thumbnails. Make them unique to each video, but also try to make sure that they’re easily recognizable as yours. This will help consolidate your brand image and make it easier for your subscribers to notice when you’ve uploaded a new video.
The same thing goes for titles: they need to be concise, exciting/intriguing, but most importantly, represent the video accurately.
BONUS TIP: Having a good introduction to your video is almost as important as having a good thumbnail. With other videos being just a click way, you only have a few seconds to hook viewers in and convince them to keep watching instead of clicking off to something else. Use a tool like Flixier to create catchy intros for YouTube by cutting out some of the most suspenseful or exciting parts of your video and moving them right to the start of the clip to make people curious about what's next.
4. The Audience tab
Last but not least, there’s the Audience tab. While this may seem pretty self-explanatory (and to a certain extent, it is), we still think it’s worth taking a closer look at it and discussing some of the finer details.
Obviously, most of this tab is taken over by demographics data such as age, gender and geographic location. We won’t delve deep into this in our blog post, but we do recommend that you pay close attention to these numbers: you might be surprised to find that videos that you intended for a certain audience might have more success with a completely different one.
Depending on what the purpose of your videos is, you can see this as either a sign that your content strategy needs some improvements, or an opportunity to pivot and cater to a completely different, but much more receptive audience.
Another thing to keep in mind here is the Average Views Per Viewer number. Obviously, this will vary depending on the type of content you’re creating, but regardless of that, the higher it is, the better. A high number of views per viewer means that your audience likes your video so much they choose to re-watch it and that’s a very good indicator that the content is valuable.

Closing Words
Thank you for reading this! We hope our article helped you understand YouTube analytics and their purpose and usefulness a little better. If you enjoyed this article, please consider checking out the rest of our blog and subscribe to our YouTube channel for more step-by-step tutorials!
If you're looking for an easier way to create YouTube videos, you might also want to consider trying out an online video editor like Flixier! Our tool runs in your web browser, is compatible with all the popular media formats and makes it easy for anyone to create engaging, professional looking YouTube videos without any video editing experience. You can even use it to record your screen, add text and motion titles and insert animated Calls to Action easily with just one click.
Dan is passionate about all things tech. He’s always curious about how things work and enjoys writing in-depth guides to help people on their content creation journey.


